Spatial Transcriptomics
1. Introduction to Spatial Omics
Spatial transcriptomics, often extended to the broader field of spatial omics, integrates molecular features (e.g., transcriptomics, proteomics) with spatial information to study gene expression or other molecular profiles within their positional context in biological samples. This approach captures not only the features of cells or molecules (such as gene expression levels) but also their two-dimensional (2D) or emerging three-dimensional (3D) locations within tissue sections. The significance lies in its ability to link biological processes to spatial organization, as proximity between cells often influences tissue function or disease progression.
Unlike traditional transcriptomics, spatial transcriptomics adds a spatial dimension, enabling researchers to explore how molecular profiles correlate with tissue structure. This opens new possibilities in translational medicine, such as deciphering how diseases alter tissue morphology or designing therapies targeting specific tissue regions.
2. Key Technologies in Spatial Transcriptomics
Several technologies enable spatial transcriptomics, each with distinct mechanisms:
2.1. Area Resolution
Visium: It excels in whole-transcriptome profiling at spot-level resolution, capturing gene expression across predefined tissue areas. Those spot often encompassing multiple cells.
Visium HD: An enhanced Visium platform with smaller spots. It delivers high-definition whole-transcriptome data with fine-scale spot resolution, enabling cellular or subcellular insights from tissue sections.
GeoMx DSP: It allows flexible, high-plex RNA or protein profiling from user-defined regions within tissue samples. This technique effectively captures spatially resolved bulk RNA or protein expression data, providing molecular insights from specific areas of interest within the tissue.
Figure 1: Visium Workflow
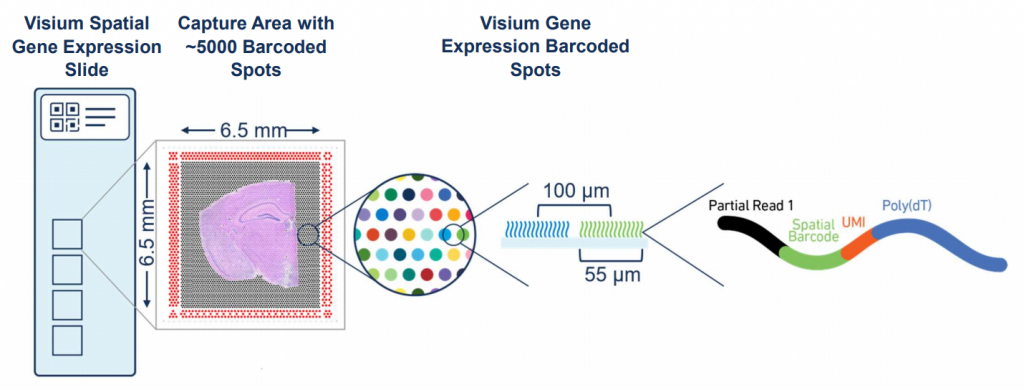
Figure 2: Visium v.s. Visium HD
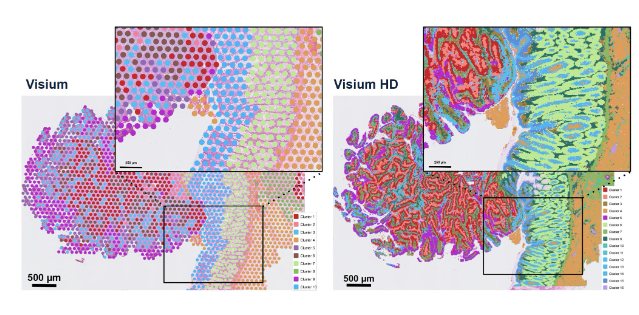
Figure 3: GeoMx DSP Workflow
2.2. single-cell resolution
Xenium: It provides targeted RNA profiles at single-cell resolution with subcellular precision, ideal for precise transcript localization, though limited to a predefined panel of hundreds of genes.
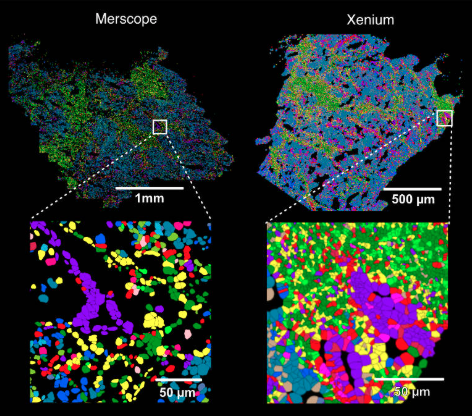
MERFISH: It produces detailed RNA expression maps at single-cell resolution, profiling thousands of transcripts across tissue samples with high multiplexing capacity, but requires longer imaging times and complex data processing compared to Xenium.
Spatial transcriptomics technologies like Xenium and MERFISH achieve single-cell resolution through their imaging mechanisms: both use probes that bind to target RNA molecules and DAPI staining to label cell nuclei to determine cell boundaries. They then count the number of probe-bound RNA molecules within these boundaries, enabling single-cell level analysis. Specifically, Xenium and MERFISH first use specific probes to detect RNA molecules in tissue sections, followed by imaging techniques to define cell boundaries. Xenium typically relies on DAPI staining and antibody staining (such as markers for cell membranes or cytoplasm) to segment cells, while MERFISH uses multiple rounds of fluorescence in situ hybridization (FISH) imaging, combined with DAPI staining and computational methods (such as RNA density-based cell segmentation algorithms) to precisely define cell boundaries. This statistical method of assigning RNA molecules within boundaries allows both to provide single-cell resolution gene expression data.
However, Xenium and MERFISH can also provide uncounted molecule-level data (molecule assay) in addition to counting RNA within boundaries (cell assay). This means they retain all RNA molecule location information inside and outside of cells, not just transcripts within cells. This complete molecular data serves as an additional resource, particularly suitable for studying viral infections, as viral RNA may be distributed outside of cells (such as in intercellular spaces or exosomes). By analyzing these data, the spatial distribution of viral RNA and its relationship with host cells can be revealed, such as local clusters of infection or patterns of spread, thereby providing unique spatial insights in viral research.
Figure 4: MERFISH v.s. Xenium
Comparison:
| Feature | Xenium | MERFISH |
|---|---|---|
| Gene Coverage | 100–500 genes, targeted and predefined, ideal for focused studies | Up to 10,000 genes, suitable for exploratory gene expression mapping |
| Sensitivity | High, excels in detecting low-abundance transcripts due to fewer probes and rapid imaging | High, but multiple probes and imaging rounds may reduce sensitivity for low-abundance transcripts |
| Impact on Cell Detection | Captures more cells in visualizations because of low-abundance transcripts detected | May miss low-abundance transcripts, potentially reducing visualized cell count due to multi-step imaging |
| Best Use Case | Targeted analysis of specific genes | Comprehensive profiling for discovering new expression patterns |
References
Article:
- https://www.biorxiv.org/content/biorxiv/early/2024/05/21/2024.05.21.593407.full.pdf
- https://www.biorxiv.org/content/10.1101/2024.04.03.586404v1.full
Image:
- https://pbs.twimg.com/media/GKdV-i-W8AE1mRw.jpg
- https://ngisweden.scilifelab.se/wp-content/uploads/2021/02/Visium-gene-expression-slide-1024x390.png
- https://mma.prnewswire.com/media/2371262/Visium_data_and_Visium_HD_data.jpg?p=facebook
- https://www.researchgate.net/publication/361642967